
Amazon Now Runs Two Different ML-Powered Attribution Models, and Most Sellers Don't Know Which One They're Reading
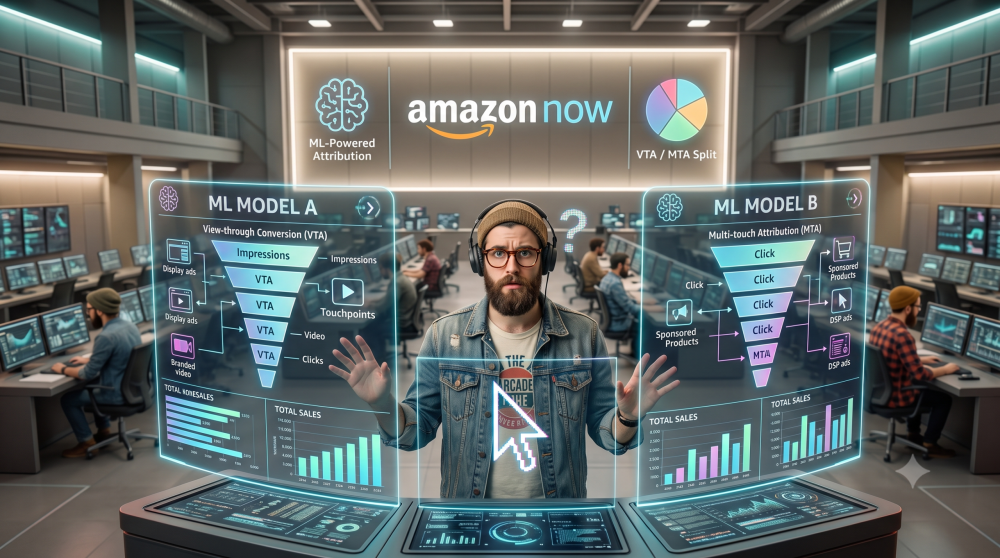
Amazon Ads attribution quietly split into two separate systems this year, and most advertisers are still reading the numbers as if only one exists.
On January 1, 2026, Amazon retired its blanket 14-day view-through window and replaced it with a shopping-signal enhanced last-touch model that uses machine learning to judge whether an ad view actually influenced a purchase, rather than just counting anyone who saw an ad and bought within two weeks.
Around the same time, Amazon separately launched a beta Multi-Touch Attribution model that distributes conversion credit across multiple touchpoints in a shopper’s path, instead of assigning it all to one interaction.
Both run on machine learning. Both changed how your numbers look. They are not the same system, and conflating them is the fastest way to misread your DSP performance this year.
The practical result: DSP advertisers are seeing double-digit declines in attributed revenue in 2026 reporting, purely from the tighter last-touch model, not from any change in actual sales.
Most teams are comparing this year’s numbers to last year’s without adjusting for the shift, which makes a measurement change look like a performance collapse.
It’s the same pattern we’ve tracked across every major ad platform this year, covered in Attribution Accuracy: Why Platforms Shouldn’t Grade Their Own Homework, just arriving on Amazon with two competing models instead of one.
The Difference Between the Shopping-Signal Enhanced Last-Touch Model and the New MTA Model
The shopping-signal enhanced last-touch model is a stricter version of the attribution Amazon already ran.
Click attribution is untouched, this update targets view-through credit specifically. Under the old system, if a shopper saw your ad and purchased anything from your brand within 14 days, that conversion could be credited to the ad, regardless of whether the view had any real influence on the decision.
The new model replaces that blanket window with an algorithm that evaluates signals like exploratory browsing, general category searches, and where a shopper sits in their discovery journey, and only credits the view if it looks like it actually mattered.
Fewer views qualify. Fewer conversions get attributed. Reported ROAS drops, even though the underlying sales didn’t change.
Multi-Touch Attribution is a different project entirely, currently in beta for US advertisers.
Instead of tightening who gets credit, it changes how credit gets split. Rather than assigning 100 percent of a conversion to the last touchpoint before purchase, MTA distributes partial credit across the path, a single sale might show up as 0.3 conversions attributed to a DSP display ad and 0.7 to a Sponsored Products click.
Metrics like Orders (multi-touch) and ROAS (multi-touch) are now appearing in the Amazon Ads console and DSP Manager alongside standard reporting.
One model makes attribution stricter. The other model makes attribution more distributed.
Both launched close together, both use machine learning, and neither one publishes the weighting logic behind its decisions, which puts advertisers in the position of trusting two separate black boxes built by the same platform that benefits from however the credit gets assigned.
Amazon isn’t alone in this: the same self-graded-homework dynamic is playing out across Meta, Google, and TikTok, just with a second internal model layered on top in Amazon’s case.
Why DSP and Sponsored Display Revenue Can Look Artificially Down Year Over Year
The January 1 change applies to Sponsored Brands, viewable-CPM Sponsored Display, and Amazon DSP campaigns serving Store inventory.
- Offsite DSP delivery is the exception and continues running on the legacy 14-day click / 14-day view window.
- For everything else in scope, the tighter model means a real, mechanical drop in reported conversions and ROAS that has nothing to do with campaign performance.
That drop shows up hardest in year-over-year comparisons. A brand comparing Q1 2026 DSP revenue against Q1 2025 without accounting for the attribution change is comparing two different measurement systems and calling the gap a performance problem.
It isn’t.
It’s a stricter judge of influence applied retroactively to how this year gets reported, while last year’s numbers were built on the old, looser standard.
This is the same dynamic we’ve tracked as rising CPMs make the gap between platform-reported ROAS and actual ROAS costlier, a measurement shift that looks identical to a spend problem until you know to check for it.
Using “Purchases (All Views)” to Build a True Apples-to-Apples Comparison
Amazon anticipated this problem and shipped a fix alongside the change: a metric called Purchases (All Views), available in Amazon Ads Unified Reporting and the Reporting (beta) tab in DSP console.
This metric preserves the original 14-day view methodology, counting every ad view within that window regardless of the new ML filtering, which means it’s the number that actually lines up with how 2025 was measured.
Pulling Purchases (All Views) as your baseline, rather than the new standard ROAS figure, restores continuity with historical performance.
Without it, any year-over-year DSP comparison in 2026 will almost always look artificially worse than it actually is. This is also the number worth pulling before a budget conversation with a client or a leadership team who’s going to look at a declining DSP line item and ask what went wrong, when the honest answer is that nothing did, the ruler changed.
Which Campaign Types Are Most Affected, and Which Are Barely Touched
Not every part of your Amazon account is equally exposed.
Amazon DSP and upper-funnel, viewable-CPM Sponsored Display are the most affected, since both lean heavily on view-through credit that the new model is specifically designed to filter.
Sponsored Brands campaigns billed on a vCPM basis fall into the same bucket.
Sponsored Products, by contrast, is barely touched.
It’s a predominantly click-based format, and click attribution wasn’t changed at all in this update. If your Amazon revenue skews heavily toward Sponsored Products, you may see almost no reporting shift from this change.
If a meaningful share of your reported Amazon revenue comes from DSP or upper-funnel Sponsored Display, expect the decline to be visible and worth explaining before someone assumes the channel stopped working.
This matters most for brands and agencies running a blended Amazon strategy across formats, since a single account-level ROAS figure can mask the split entirely.
A brand running mostly Sponsored Products with a smaller DSP layer might see overall reported ROAS dip only slightly, while the DSP portion alone shows a much sharper decline underneath it.
Breaking out performance by campaign type, rather than reading one blended number, is the only way to see which part of the account is genuinely affected by the January change and which part was never touched.
Building an Amazon Measurement Approach That Doesn’t Depend on Trusting Either Black Box
Two platform-native models, two separate machine learning systems, and zero visibility into how either one actually weighs a signal or splits credit, that’s not a foundation to build a budget decision on, even with Amazon’s own fix-metric in hand.
Purchases (All Views) solves the year-over-year comparison problem.
It doesn’t solve the deeper one: you’re still trusting Amazon’s algorithm to tell you how much of your Amazon-attributed revenue is real.
The way out isn’t picking whichever of Amazon’s two models produces a more flattering number.
It’s checking both against something Amazon doesn’t control. Independent, click-based measurement tied to your own first-party order data gives you a number that doesn’t move every time Amazon adjusts what its machine learning model considers a meaningful shopping signal.
Watching standard ROAS against multi-touch ROAS is a useful internal signal, a large gap between the two tells you upper-funnel DSP is probably contributing more than last-touch reporting shows, but neither number is independently verified, and both come from the platform being measured.
AdBeacon’s Amazon Ads integration already tracks your DSP, Sponsored Display, and Sponsored Products performance against first-party order data. If you want to see what your Amazon numbers look like against independent measurement instead of Amazon’s own shifting model, book a live AdBeacon demo to compare the two side by side.
—-
FAQ
What changed with Amazon’s attribution on January 1, 2026?
Amazon replaced its blanket 14-day view-through attribution window with a shopping-signal enhanced last-touch model that uses machine learning to judge whether an ad view actually influenced a purchase before crediting it. Click attribution was not affected.
Is Amazon’s Multi-Touch Attribution the same as the new last-touch model?
No. The shopping-signal enhanced model makes last-touch attribution stricter about which views get credit. Multi-Touch Attribution, a separate beta, distributes conversion credit across multiple touchpoints in a shopper’s journey rather than assigning it all to one interaction.
Why does my Amazon DSP revenue look lower than last year?
If you’re comparing 2026 reporting to 2025 without adjusting for the attribution change, you’re comparing two different measurement systems. Pull the Purchases (All Views) metric to build a comparison that matches the old methodology.
Which Amazon campaign types are most affected by the attribution change?
Amazon DSP, viewable-CPM Sponsored Display, and vCPM Sponsored Brands campaigns are the most affected, since they rely heavily on view-through credit. Sponsored Products, being predominantly click-based, sees minimal impact.
How can I check Amazon’s reported numbers against something independent?
Pair Amazon’s Purchases (All Views) metric for historical continuity with independent, first-party, click-based measurement tied to your own order data, so your budget decisions aren’t built entirely on either of Amazon’s two internal models.