
Shopify Redesigned Checkout for Higher Conversion. Your Baseline Numbers Just Changed With It.
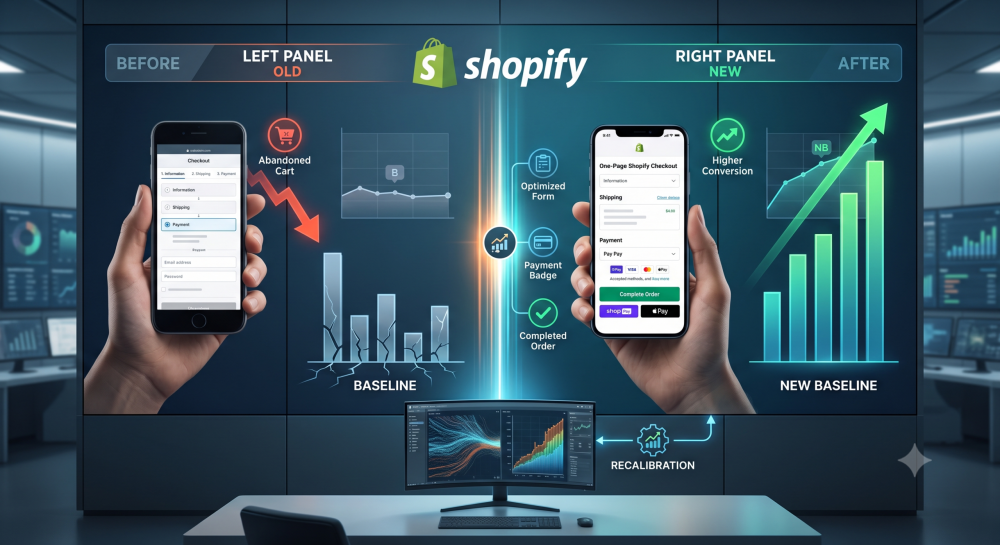
If your Shopify store’s conversion rate ticks up over the next few weeks, don’t assume it’s the campaign you just launched.
Shopify’s Spring 2026 Editions, released June 17, 2026, shipped a redesigned hosted checkout that the platform itself describes as “higher-converting,” with a tighter layout, a more prominent pay button, and less scrolling on mobile.
Shopify hasn’t published a figure to back that label, so it’s worth treating “higher-converting” as the platform’s own framing rather than a guaranteed lift for your store specifically.
But the redesign rolled out to every merchant on Shopify’s hosted checkout automatically, not as an opt-in feature, which means any change in your numbers this quarter could be the checkout doing its job rather than your marketing.
That distinction matters more than it sounds.
If you can’t isolate a checkout-driven lift from a campaign-driven one, you’ll end up crediting the wrong lever, and figuring out how to calculate true ROAS for a given campaign becomes impossible if the baseline it’s measured against just moved for reasons that have nothing to do with the ad.
Getting this right before touching next quarter’s testing budget is the entire point of this post.
What Actually Changed in the Spring 2026 Checkout Redesign
The redesign touches Shopify’s hosted checkout specifically, the page a customer sees after clicking through to pay, not the storefront or product pages around it.
Three changes are doing the work: delivery options are restructured to be easier to scan at a glance, the pay button is more visually prominent, and the mobile layout requires less scrolling to reach the point of payment.
Shopify also shipped managed payment methods alongside the redesign, which reorders the payment options shown to each buyer based on signals like location and purchase history, surfacing whichever method is statistically most likely to convert for that specific shopper rather than showing a fixed list to everyone.
A few things are worth knowing about how this rolled out.
It’s presented as an update to Shopify’s existing hosted checkout, not a feature you switch on or opt into, so if you run checkout customizations or Checkout Extensibility blocks, the practical first step is confirming they still render correctly, especially on mobile, where custom checkout flows tend to break first.
And because it’s not a toggle, there’s no native way to A/B test the old checkout against the new one within your own store, Shopify’s Rollouts tool can A/B test theme and checkout-configuration changes you make, but it can’t recreate a pre-redesign control group after the fact.
How to Isolate a Checkout-Driven Conversion Lift From a Campaign-Driven One
Since there’s no built-in A/B test available for this specific change, isolation has to happen through funnel segmentation rather than a controlled experiment.
The key move is separating checkout-to-purchase rate from your overall site conversion rate, rather than reading one blended number and guessing at the cause.
Overall conversion rate is affected by traffic quality, campaign targeting, creative, pricing, and checkout performance all at once, which makes it useless for isolating a single platform-level change.
Checkout-to-purchase rate, completed checkouts divided by initiated checkouts, only measures what happens after a customer has already decided to buy and started the payment process.
A jump in that specific number immediately after June 17, 2026, with no corresponding change to your campaigns, creative, or pricing, points squarely at the redesign rather than anything your team did.
If overall conversion rate moved but checkout-to-purchase rate didn’t, the redesign likely isn’t the explanation, and the credit belongs somewhere else in the funnel.
Why Re-Baselining Checkout-to-Purchase Rate Matters Before Touching Ad Budgets
This is where the stakes get real.
If a brand sees conversion rate improve in late June or July and attributes it to a new campaign or creative angle, the natural next move is to scale that campaign, double down on the creative, and expect the lift to repeat.
If the actual driver was the checkout redesign, that expectation is wrong, and the next quarter’s testing budget gets spent chasing a result that was never really about the campaign in the first place.
Re-baselining means establishing a new checkout-to-purchase rate benchmark that reflects the redesigned checkout, before drawing conclusions about anything else.
Once that new baseline is set, campaign-level ROAS comparisons going forward are measured against a checkout that’s already accounted for, rather than an outdated pre-redesign number that makes every subsequent test look artificially better or worse than it actually is.
This is the same discipline behind how to calculate your true ROAS: the number is only meaningful if the baseline underneath it is current and isolated from unrelated platform changes.
Where to Find Current Checkout Completion Benchmarks by Vertical and Device
Benchmarking your own checkout-to-purchase rate only means something in context, since the “right” number varies enormously by vertical, device mix, and average order value.
Aggregated data across Shopify storefronts puts a good blended checkout completion rate in the 45 to 55 percent range in 2026, with top-decile stores reaching 60 to 75 percent on the strength of clean express payments and visible trust signals.
Broader industry data outside Shopify specifically puts the average checkout completion rate closer to 47 percent, with top performers clearing 60 percent.
Device matters as much as vertical.
Mobile checkout completion typically runs 10 to 15 percentage points behind desktop on the same store, and vertical, AOV, and traffic source can each shift the benchmark by another 10 to 20 percentage points on top of that.
A luxury or high-consideration category will naturally post a lower checkout completion rate than a consumables or beauty brand, which means the useful comparison isn’t against ecommerce broadly, it’s against your own vertical, your own device split, and your own historical trend.
Benchmark against those first, then use the redesign’s rollout date as the line where your own before/after comparison starts.
Checkout performance is one piece of a larger conversion picture, and it’s worth reading alongside the other proven CRO strategies ecommerce brands are using in 2026 rather than treated as the only lever worth watching this quarter.
Building a Simple Before/After Comparison to Credit the Change Correctly
The comparison itself doesn’t need to be complicated.
Pull checkout-to-purchase rate for a comparable window before June 17, 2026, and the equivalent window after, holding traffic source and campaign activity as steady as possible across both periods.
Segment by device
Since mobile and desktop are likely to respond differently to a redesign that specifically targeted mobile scrolling.
Checkout-to-purchase rate
If checkout-to-purchase rate moved meaningfully on mobile but barely shifted on desktop, that’s a strong signal the redesign, not a campaign change, is the driver, since the redesign’s changes were mobile-weighted to begin with.
Check the dates
Document the date clearly, the same way you’d annotate any platform attribution change, so a future analyst looking at a quarter-over-quarter comparison doesn’t misread a step change in checkout performance as a marketing win or loss.
This is the same principle behind isolating how a single line of checkout copy moved revenue 9 percent in a controlled test, credit only goes to the right lever when the comparison is actually isolated to that lever.
Independent measurement that isn’t blended into “whatever Shopify shipped this quarter” is what makes this kind of isolation possible in the first place, the same reasoning behind why platform-reported ROAS and actual ROAS drift apart whenever the underlying baseline shifts without anyone noticing.
Book a live AdBeacon demo to see how first-party attribution keeps platform-level changes and campaign performance separated, so your true ROAS reflects what your marketing actually did.
—-
FAQ
Did Shopify publish a specific conversion lift figure for the Spring 2026 checkout redesign?
No. Shopify describes the redesign as “higher-converting” but hasn’t published a supporting figure, so that description should be treated as the platform’s own wording rather than a guaranteed result for any individual store.
Can I A/B test the old Shopify checkout against the new one?
No. The redesign is a default update to Shopify’s hosted checkout, not an opt-in feature, so there’s no way to run a controlled test against a pre-redesign control group after the fact.
What metric should I check first to see if the redesign affected my store?
Checkout-to-purchase rate, completed checkouts divided by initiated checkouts, isolates what happens after a customer starts paying, separate from traffic quality, campaign performance, or pricing changes elsewhere in the funnel.
What’s a good checkout completion rate benchmark in 2026?
Aggregated Shopify data puts a good blended rate around 45 to 55 percent, with top-decile stores reaching 60 to 75 percent. The right number for your store depends heavily on vertical, device mix, and average order value.
Why does re-baselining matter before scaling a campaign that looks like it’s working?
If a conversion lift actually came from the checkout redesign rather than the campaign, scaling that campaign expecting the same result will disappoint, and the budget spent chasing it would have been better used testing something that was actually responsible for the improvement.