
Buy Now Pay Later Is Quietly Wrecking Your Real Conversion Numbers
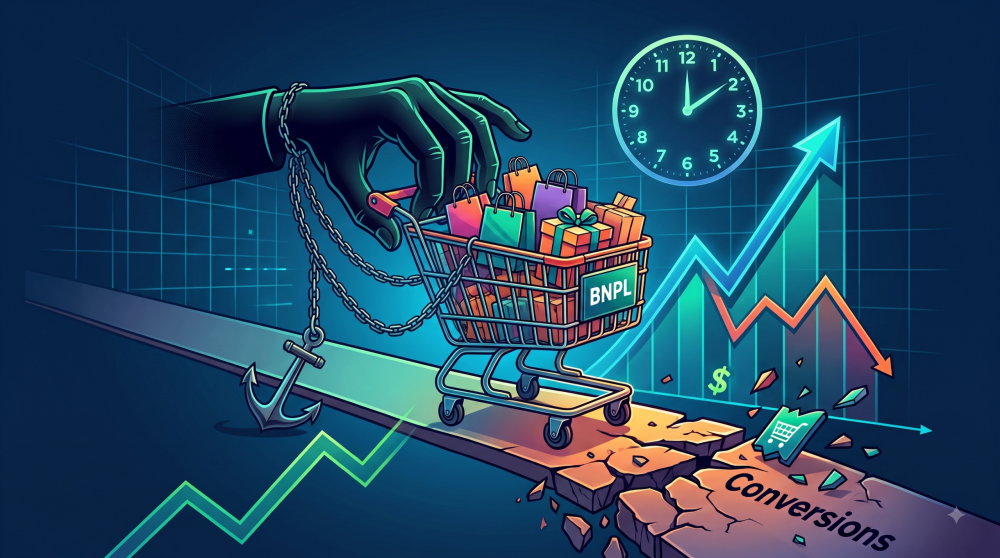
BNPL now drives roughly 5 to 6 percent of US online transactions, and most brands treat that line item as a clean win: higher conversion, higher average order value, done.
The number sitting in your checkout report isn’t lying. It’s just not the whole story, and the part it leaves out is the same part every platform-reported metric leaves out: what happens after the sale counts as a sale.
AdBeacon has written before about why platforms shouldn’t grade their own homework when it comes to ad reporting.
BNPL is the same problem, just self-inflicted.
Return rates on BNPL orders run dramatically higher than on card purchases. One outdoor-gear retailer recorded a 41 percent return rate on BNPL orders versus 22 percent on credit-card purchases.
Most BNPL providers don’t refund their transaction fee when an order comes back. Brands crediting BNPL for the conversion and AOV lift without netting out returns and fees are looking at an inflated number, a self-inflicted version of the same “platform grades its own homework” problem that shows up everywhere else in e-commerce measurement.
Why BNPL Lifts the Numbers Everyone Sees First
The mechanics of the lift are well documented and genuinely real.
BNPL reduces the friction of a purchase decision by splitting the sticker price into smaller pieces, and that friction reduction shows up directly in conversion and AOV.
Merchant-reported lift figures vary widely by source and methodology, everything from a conservative roughly 17 percent conversion bump up to vendor-marketed numbers in the 40 to 90-plus percent range, but the underlying mechanism isn’t in dispute: spreading a $200 purchase into four $50 payments genuinely gets more people to click “buy.”
That’s the number that shows up first, fastest, and most visibly, in the checkout report, in the payment provider’s own dashboard, in the pitch a BNPL provider gives when trying to win your integration.
It’s also, structurally, a number the provider has every incentive to make look as good as possible, since a bigger reported lift is the entire sales pitch.
The Return Rate Problem Nobody’s Dashboard Surfaces
Here’s the mechanism that doesn’t show up in that first number: financing reduces the friction of buying, but it also reduces the friction of over-buying.
A shopper deciding between two sizes, two colors, or “maybe I’ll just get both and return one” faces a much smaller immediate cost when the decision is $50 today instead of $200 today.
That’s exactly the behavior the 41-versus-22-percent gap reflects, and while that specific figure comes from a single retailer rather than an industry-wide average, more than 13 percent of all BNPL transactions have involved a return or dispute in broader research, and the direction of the pattern shows up consistently across sources.
The compounding part is the fee.
Most BNPL providers charge merchants a per-transaction fee, commonly in the 2 to 8 percent range depending on the provider and plan, and most don’t refund that fee when the order is returned.
That means a high return rate on BNPL orders isn’t just lost revenue from the returned item.
It’s revenue you never keep, plus a fee you paid to acquire it, plus whatever return-shipping and restocking cost came with it. A conversion or AOV lift calculated before netting any of that out isn’t wrong, exactly. It’s measuring the transaction, not the outcome.
What Brands Are Actually Comparing When They Report BNPL Performance
This is where the “self-inflicted” framing matters.
Every platform-reported ROAS number has the same structural flaw: it’s calculated by an entity with an incentive to make the number look good, using a definition of success that conveniently excludes the parts that would make it look worse.
Meta’s attribution window doesn’t account for returns. Neither does a checkout report that credits BNPL for every completed transaction without adjusting for what comes back.
The difference is that with an ad platform, the incentive misalignment is external, someone else’s system reporting a number that favors them.
With BNPL performance reporting, the brand is often doing this to itself.
Nobody at a BNPL provider is required to tell you your return rate on their transactions is running double your card baseline. That number lives in your own return data, cross-referenced against payment method, and most brands simply haven’t built the report that connects the two.
How to Build a Real Number Instead of a Platform-Favorable One
- Segment return rate by payment method, not just by product or channel. If BNPL orders return at a meaningfully higher rate than card orders, that’s the single most important number missing from most BNPL performance conversations.
- Net out unrefunded fees on returned BNPL orders before calculating true incremental revenue from the payment method. A transaction that gets returned and still costs you a 4 percent fee is not a break-even outcome, it’s a loss.
- Calculate BNPL’s contribution margin, not just its conversion lift. Conversion and AOV lift are real, but they’re inputs to a margin calculation, not the calculation itself.
- Watch return rate trends over time, not just at launch. A BNPL integration that looks clean in its first quarter can develop a higher-return customer base as usage grows into more discretionary, less-considered purchase categories.
- Treat this the same way you’d treat any platform-reported metric: useful as a directional signal, not as ground truth, until it’s checked against your own first-party order and return data.
If you want to see your true return-adjusted BNPL performance alongside every other channel, tied to your own store data instead of a payment provider’s own dashboard, book a live AdBeacon demo.
—-
FAQ
How much higher are return rates on BNPL orders compared to card purchases?
One outdoor-gear retailer recorded a 41 percent return rate on BNPL orders versus 22 percent on credit-card purchases. That specific figure comes from a single retailer rather than an industry average, but broader research has found more than 13 percent of all BNPL transactions involve a return or dispute.
Why does BNPL lead to higher return rates?
Splitting a purchase into smaller payments reduces the immediate cost of a buying decision, which also reduces the friction of over-buying, ordering multiple sizes or colors with the intent to return some, for example. Lower purchase friction cuts both ways.
Do BNPL providers refund their fee when an order is returned?
Most providers do not refund the transaction fee on returned orders. That means a returned BNPL order typically costs the merchant the fee on revenue they never actually keep, on top of the lost sale itself.
What percentage of US online transactions use BNPL?
BNPL represents roughly 5 to 6 percent of US online transactions as of 2026, a share that has grown steadily as more checkout flows integrate providers like Klarna, Affirm, and Afterpay.
How should brands measure BNPL performance more accurately?
Segment return rates by payment method, net out unrefunded fees on returned BNPL orders, and calculate contribution margin rather than relying on conversion or AOV lift alone, which measures the transaction but not the outcome.