
55% of Advertisers Don't Trust Retail Media Attribution. Here's the Gap Nobody's Fixing.
Amazon Ads attribution, and retail media attribution generally, has a trust problem that’s growing faster than anyone is fixing it.
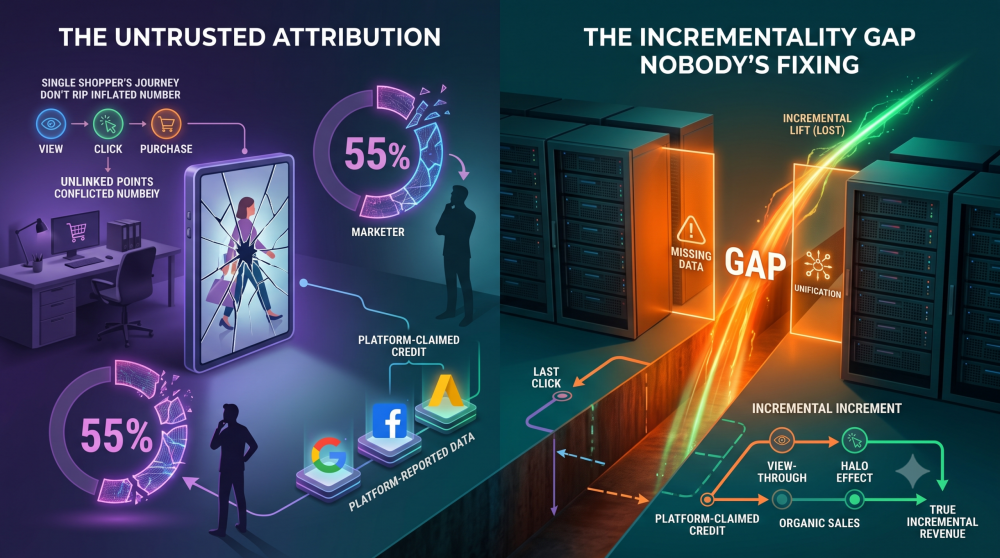
EMARKETER reports that 55 percent of US advertisers say targeting and attribution from retail media networks is inconsistent, and that number is landing at the exact moment retail media spend keeps climbing regardless.
US retail media advertising reached roughly $58.79 billion in 2025, is projected to hit $69.33 billion in 2026, and is on track for $100 billion by 2028, growing at nearly 20 percent annually against 4.3 percent for the overall ad market.
Three-quarters of advertisers plan to increase retail media spending this year. The budgets are scaling faster than the measurement standards that would justify the growth.
The networks keep adding inventory and integrations on top of that gap rather than closing it.
One platform’s product update brought Walmart Connect data directly into its platform, letting brands compare Walmart performance against their other channels inside the same dashboard for the first time.
That’s a genuinely useful convenience that doesn’t touch the underlying problem: a brand running Amazon, Walmart, and its own DTC channel still has no consistent way to compare performance across all three, because each one measures a “conversion” by its own rules.
What the 55% Inconsistency Stat Actually Captures and Why It Matters
The eMarketer figure isn’t advertisers complaining about a minor reporting quirk.
It reflects a structural reality: retail media networks each set their own attribution windows, their own definitions of what counts as an assisted versus a direct sale, and their own thresholds for crediting a view versus a click, and those definitions are rarely disclosed in enough detail for an advertiser to reconcile them against each other.
A related EMARKETER and Bain survey found 48% of retail media network respondents themselves, not just advertisers, name measurement and attribution as their top challenge.
The inconsistency isn’t a one-sided advertiser complaint, the networks running these systems largely agree the measurement isn’t solid either.
That matters because retail media budgets are increasingly justified by the ROAS each network reports, and if that ROAS isn’t built on a consistent, comparable methodology, the case for scaling it further is resting on numbers nobody, including the networks themselves, fully trusts.
How Amazon’s and Walmart’s Attribution Methodologies Differ From Each Other
The two largest retail media networks measure conversions in genuinely different ways, and neither is wrong exactly, they’re just not comparable without adjustment.
Amazon moved on January 1, 2026 from a blanket 14-day view-through window to a shopping-signal enhanced last-touch model that uses machine learning to judge whether an ad view actually influenced a purchase before crediting it, applying to Sponsored Brands, viewable-CPM Sponsored Display, and DSP campaigns.
Amazon hasn’t disclosed the exact length of the new window. Click attribution on Amazon remains unchanged and separate from this shift.
Walmart Connect runs on a different structure entirely: click attribution windows of 14 or 30 days depending on campaign configuration, shorter view-attribution windows for display and video, and a closed-loop measurement system that connects ad exposure to purchases across online, pickup, delivery, and in-store channels using identity resolution tied to Walmart+ membership and payment data.
That omnichannel view is a real capability Amazon doesn’t match in the same way, but it also means Walmart’s reported ROAS can run 20 to 30 percent higher once in-store halo sales are included, a category of “conversion” that simply doesn’t exist in an Amazon report.
Both platforms use last-touch logic within their own ecosystem and both have moved toward ML-driven, signal-based credit allocation rather than fixed windows, but the specifics, what counts as a qualifying signal, what window applies, whether offline sales are in scope, differ enough that a raw ROAS-to-ROAS comparison between the two is measuring different things and calling them the same metric.
Amazon’s own attribution picture is more fractured than a single number suggests too, it’s now running two separate ML-powered attribution models simultaneously, which means even a same-platform comparison needs care before it gets anywhere near a cross-network one.
Why Comparing Retail Media ROAS to DTC Channel ROAS Is Rarely Apples to Apples
Layer a brand’s own DTC channel on top of that and the comparison gets harder still.
DTC attribution, whether platform-native or first-party, typically runs on click-based logic with a defined lookback window the brand controls.
Retail media ROAS is built on each network’s own definition of a conversion, frequently including view-based credit, halo sales on adjacent products, and in some cases offline purchases a DTC brand has no equivalent category for.
Putting an Amazon ROAS, a Walmart omnichannel ROAS, and a DTC click-based ROAS side by side in the same spreadsheet and treating them as directly comparable numbers is the mistake this creates.
They’re built on three different methodologies, three different definitions of a conversion, and in Walmart’s case, a category of sale, in-store, that the other two can’t see at all.
A budget decision built on that comparison is built on noise dressed up as signal.
A Practical Framework for Normalizing Retail Media Performance Against Everything Else in the Mix
Normalizing across these channels starts with documenting, not assuming, what each network’s ROAS actually includes: which attribution window, whether view-based credit is counted, whether halo or assisted sales are included, and whether offline channels are in scope.
Once that’s mapped, the comparison should run on the narrowest common definition across all channels, typically click-based, direct-product attribution within a matched window, since that’s the closest thing to an apples-to-apples baseline available across Amazon, Walmart, and DTC.
From there, treat each network’s fuller, platform-native ROAS as a separate, labeled figure rather than blending it into the same column as everything else.
A brand can still use Walmart’s omnichannel view to understand halo effect and in-store lift, that’s genuinely useful information, but it shouldn’t sit in the same comparison table as an Amazon click-based figure without a clear label distinguishing what each number does and doesn’t include.
This is the same discipline behind why Meta, Google, and TikTok ROAS never agree, and it applies just as directly once Amazon and Walmart are added to the same budget conversation.
Where Independent Measurement Closes the Gap Retail Media Networks Have No Incentive to Close
Retail media is the newest version of a familiar pattern: each network reports its own numbers, using its own methodology, with every incentive to make its own channel look as effective as possible, and no incentive to standardize against a competitor’s definition of a conversion.
That’s not a conspiracy, it’s just structural, the same dynamic we’ve tracked in why platforms shouldn’t grade their own homework, now showing up across retail media specifically, and it’s compounded here by 55 percent of advertisers openly saying they don’t trust the result.
An independent measurement layer that sits above every retail media network, rather than inside any single one, is what makes an honest comparison possible.
It doesn’t need Amazon and Walmart to agree on a shared standard, because it isn’t relying on either one’s internal definition of a conversion in the first place, it’s built on first-party order data that means the same thing regardless of which channel the sale came through.
That’s the layer that turns a 55 percent trust gap into an actual answer rather than a number brands have learned to shrug at. Book a live AdBeacon demo to see how independent measurement compares your Amazon, Walmart, and DTC performance on one consistent basis.
—-
FAQ
What does the 55% retail media attribution statistic actually measure?
It’s an EMARKETER finding that 55 percent of US advertisers report inconsistent targeting and attribution from retail media networks, reflecting structural differences in how each network defines and measures a conversion rather than a single shared complaint.
Do Amazon and Walmart use the same attribution methodology?
No. Amazon uses a shopping-signal enhanced last-touch model for view-based campaigns with an undisclosed window length, while Walmart Connect uses configurable click windows of 14 or 30 days plus closed-loop measurement that includes online, pickup, delivery, and in-store purchases, a category Amazon’s standard reporting doesn’t capture.
Why can Walmart’s reported ROAS be higher than Amazon’s for a similar campaign?
Walmart’s omnichannel ROAS can run 20 to 30 percent higher once in-store halo sales are included through its closed-loop measurement system, a category of conversion that doesn’t exist in Amazon’s standard attribution model.
Is it accurate to compare Amazon ROAS directly to my DTC channel’s ROAS?
Not without adjustment. DTC attribution is typically click-based with a brand-controlled window, while Amazon’s ROAS includes its own view-based and last-touch logic, so a direct comparison is measuring different definitions of a conversion side by side.
What is the first step to normalizing retail media performance across channels?
Document exactly what each network’s reported ROAS includes, attribution window, view-based credit, halo sales, offline channels, then compare all channels on the narrowest common definition, typically click-based, direct-product attribution within a matched window.